Understanding Students’ Learning Journeys

1. On your landing page, click on the Learning Journey icon on your class card (see right). You can also access the Learning Journey page after you have clicked on the class card
.
To do this, click on the “Advanced” tab at the top of your page.

Then, click on the “Learning Journey” tab (see below).

2.The Learning Journey shows your course’s content broken down by grade, domain, and competency. It also shows the collections and assessments associated with each.

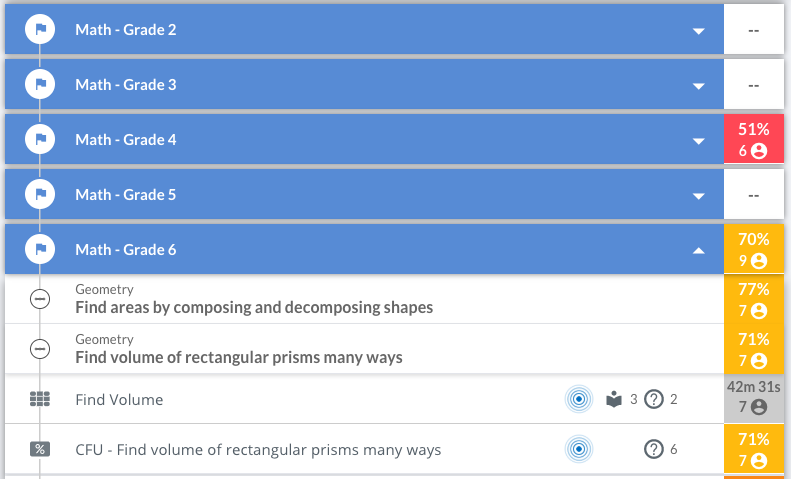
In this example (left) we have clicked on the competency “Find the volume of rectangular prisms many ways” in Grade 6 geometry.
There is a collection of resources (“Find Volume”) and an assessment (“CFU”) tagged to this competency.
The Learning Journey provides a summary of your student’s average performance on each competency. In the example above, 7 students scored an average of 71% on the assessment (“CFU – Find the Volume of Rectangular Prisms”).

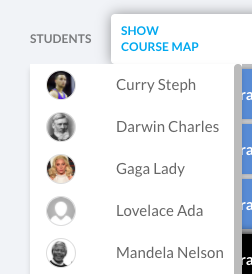
3. To monitor the progress of individual students, hover over the avatars shown on the left side of the screen. This will expand to show your students’ names.
4. Click on any student’s name to view their progress.
In the example below, we clicked on Kate Middleton’s avatar. We see that Kate has completed 7% of her assigned Grade 5 math with an average score of 10%.

5. Click on any item in the course map to get more information.
When we click on the “Math – Grade 5” milestone for Kate, we can see her individual assessment scores.
Competencies are listed sequentially in each student’s Learning Journey. Those shown in gray (e.g., “Parentheses in Numerical Expressions” below) indicate that the student showed mastery before starting work in Gooru. This information comes from diagnostic scores and/or benchmark data.
Items in white are active in the student’s Learning Journey and should be completed to build their Skyline.


0 Comments